"Smart" Point Placement in Grid Sampling
How to Place Points for Maximum ROI
Why We Created this Page
Several precision ag programs have asked about improving point placement in grid sampling, so we’d like to share some techniques we’ve seen in leading precision soil sampling programs.
Let me say first, I know this isn’t for everyone. It takes time, and in some fields nutrient variability just doesn’t match the data layers we have. But I do think these techniques are underutilized.
Intuitive Explanation: Arranging Points Along Natural Variability Trends
The intuitive side of this is just that if we arrange our points along the natural variability trends of pH, P, and K, we’ll end up with a more accurate map than if we follow a straight grid.
Variability We Want to Model

Grid-Modeled Variability

Regardless of where people stand on the rest of the grids vs. zones debate, everyone I’ve met agrees that these trends exist and tend to be reflected in other data layers that we have for each field. This has nothing directly to do with sample density, interpolation methods, core distribution, or any of that.
Measuring Value creation
My First Field Trial
I dug into this initially because of a field trial where we were able to pull only 4 samples from specific places in an 80-acre field (20 acres/sample density), model the spatial variability with these layers, and compare that to a high-density, half-acre grid. We found that the smart model depicted the spatial variability of CEC better than a 2.5 ace grid would have. CEC is easier than nutrients to model – but this showed me that point placement can make a significant difference.
Built My Own Smart Model
So I dug deeper, I modeled a few field’s based on just a grid, then modelled it using my own concoction of data layers, and compared them both to real soil tests at 118 points. The results were unexpectedly decisive, even if the potassium results were a bit of a fluke.

Study with Precision Planting
So finally, I looked at a study we did with Precision Planting before I came to the company, where we compared several techniques to a 1/16th acre grid, and found essentially that smart points provided more accurate soil data, better VRT maps, and roughly $25/ac in value.
That’s not gonna pay for my vacation, but it’s great for the level of effort involved, and demonstrates that real value can come from precision soil sampling.
Picking Data Layers
Soil Type/Texture
NRCS Soil Survey
The most common data layer I’ve seen used is soil type or texture, and this generally works well.
The USGS gathered this data over the last century really by having people literally walk over and visually inspect the ground, and send samples to labs.
The best part – it’s free online.
Nutrient variability within these soil types depends on a lot of factors. But for a ballpark, on one farm I looked at, I calculated the average of all points taken within each soil type. Most individual points differed from their soil type average by roughly:
- pH: 0.3
- P: 20 ppm
- K: 40 ppm
This method isn’t perfect. Some fields are made up of just one soil type, and in others this data was gathered poorly or has changed. I’d recommend talking to someone familiar with your county’s data in particular to gauge it’s usefulness to you.
Where to Download Soil Type Data

Example NRCS Map

Electrical Conductivity (EC) Mapping
If you want to gather your own data, though, electrical conductivity (EC) mapping with a Veris cart or an EM38 is pretty similar to soil type. Both are getting more popular in precision soil sampling programs. EM38 readings tend to have a pretty strong correlation to the core components of soil texture, but they may not be as good at directly predicting nutrient levels. Most academic studies tend to agree on this, and I’ve pulled this data in particular from a paper that came out of UC in 2010.
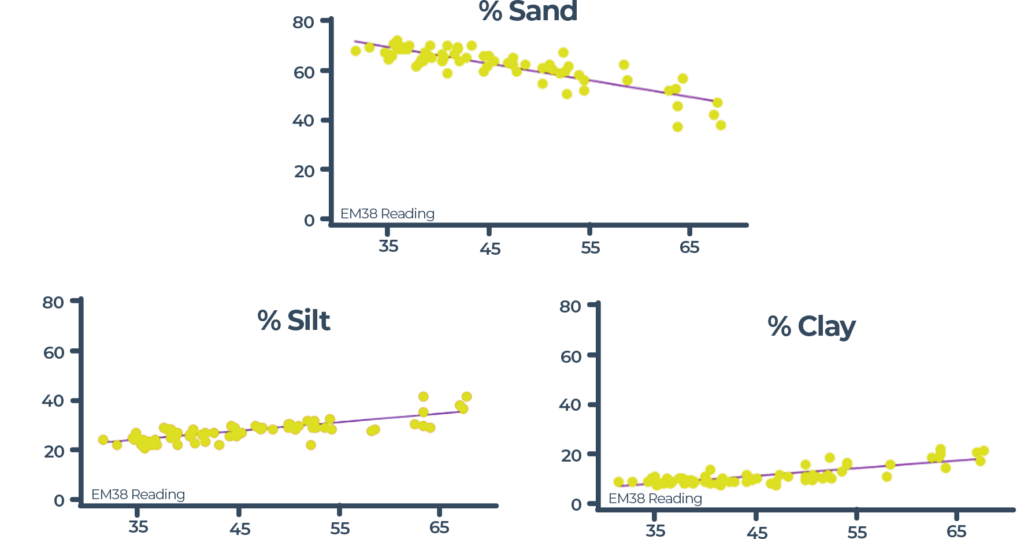
Previous Grid Samples (Specifically CEC/OM)
You can also use nutrient data from previous grid samples. The best way to do this is to sample with a very high density grid once, and then use either CEC or organic matter from that soil map to pick your points in the future. Basically, the high density grid reveals the variability patterns, so we assume from then on that our pH, P, and K levels continue changing according to those patterns.

Topography
Elevation and/or Slope
Topography’s getting more popular, and for good reason, because elevation drives water flow. Water flow can move nutrients around quite a bit before they’re incorporated into the soil, especially in no-till situations.
Elevation and slope are the easiest layers to get access to, and you can usually pull them directly into your software from public LIDAR data.
Topographic Wetness Index (TWI)
One method that’s becoming more popular is a topographic Wetness Index (TWI) map, which basically uses both elevation and slope to categorize the field based on different levels of water accumulation.
It’s a great tool but usually takes some custom geospatial analysis to create.

Crop Performance
Yield or Satellite Imagery (NDVI)
Some people also use crop performance from previous seasons – yield is the strongest way of doing this, but if it’s hard to get a yield map from some customers, satellite imagery is a solid substitute. NDVI comes free with some agronomy software, it’s “Normalized Difference Vegetation Index,” and it essentially measures leaf density using infrared light – healthy crops actually reflect more.
Truthfully... Nutrients Don't Always Correlate Well With Crop Performance
Yield can sometimes correlate fairly well with pH, especially in more acidic soils where pH is a limiting factor.
I’ll be honest though. Unless a nutrient is a yield-limiting factor, it usually won’t impact yield. Sometimes you can see an inverse correlation where higher yields have removed more of some nutrients, but that’s usually pretty weak.
It’s confusing because nutrient deficiencies can be in either a high-yield area (where a great crop last year emptied the soil), or a low yield area (where the deficiency actually caused the low yield).

I would actually use crop performance very differently from soil type and topography – let me show you my software process.
Software Workflow
Creating Multi-Layered Zones
I know most mainstream agronomy software can’t create these points automatically, but they aren’t your only option. It’s a little extra work, but you can upload your boundary and data layers into separate software tools, if you need to.
I’m using GeoPard’s software in this clip, because it lets me create as many zones as I want.
I’ll just create a multi-layered zone map,
add my data layers from before and set weights.
I’m gonna recommend that you weigh more accurate data higher, and generally that means really focusing on soil type and topography. You can include crop performance here if you want, but I prefer to do that separately.
Now I choose my sample density – this is a 60-ac field, so I’ll do 24 zones for 2.5-ac/sample density.
We could have a whole other discussion here about where to take your cores in these zones and how many cores to take, but for now I’ll just pull 6 cores from one sample site in the middle of each zone, so that when I krig the soil tests, each zone looks most like the sample in the middle.
From here your sampling points can go directly to your sampling provider – just make sure they know not to change their sample IDs.
Adding "Special Points"
This is where I’d incorporate other layers that don’t always correlate well with soil test values – specifically crop performance.
A nutrient deficiency may be responsible for these yield variations, so I’ll take a sample there to test for it. But in case it’s not, I don’t want to throw off my entire map by moving my sample point there.
So I’ll overlay my zones and points on a yield or NDVI map, and if any individual zone has wild yield variability, I’ll just drop in an extra point there.
In this clip, I’m working in an open-source system called QGIS.
Conclusion
And that’s it. This does take some extra work, and because of that it’s normally a better fit for growers who have made or are willing to make a multi-year commitment. But if you have an appetite for it, I do think it’s an intuitive, relatively simple way to create more value in your precision ag program.
If you actually took the time to read this entire article, please send me an email (corey.h@rogoag.com) and we can set up a time to chat. I genuinely enjoy open ended conversations about bringing precision ag programs to the next level, even if they have nothing to do with our robotic soil sampling services.
We’ve also got other videos on agronomy topics coming soon to our YouTube channel and website, so if this was helpful to you, be sure to check those out, too.
How To Balance Cost & Accuracy in Soil Sampling
